I love a well put together map that tells a story - an artful visual that seems to convey information in a way that transcends a spreadsheet or conversation.
As a member of the logistics and transportation industry over the past five years, I wanted to share the wealth of my research and relay a few of my favorite tools that will hopefully come in handy based on the context of your next project. While some of these tools are easier to use than others, it all goes back to what your end goal is – the story that you’re trying to tell.
As visual learners make up about 65% of the population, there’s a good chance that the audience you're presenting to next will appreciate a good piece of cartographic art.
I've hyperlinked to each of these favorite sites, so simply click the title if you're interested in learning more about the tool or using it yourself. If I missed one of your favorite tools below, please comment so that we can all benefit from it!
Google My Maps
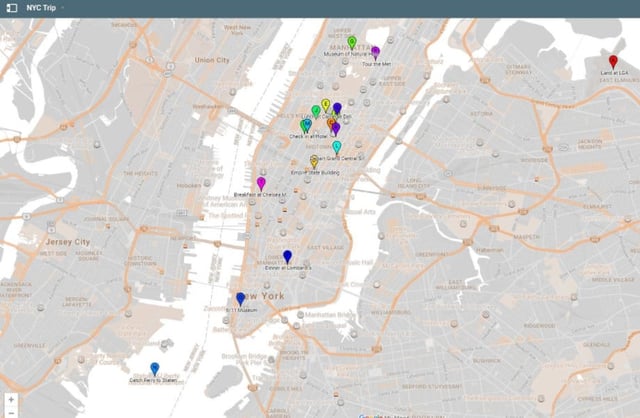
We all use Google.com/maps for directions, but this takes it to another level. Think digital pushpins on Google maps, with the ability to color-code and add additional information when you click on the pushpin. Whether you’re planning your next vacation, mapping out your current business locations, or simply looking to share a list of delivery locations with others, this is your tool.
It’s an easy to learn tool that allows you to upload and update information from Google Sheets as well as share maps with additional users.
MultiPlottr
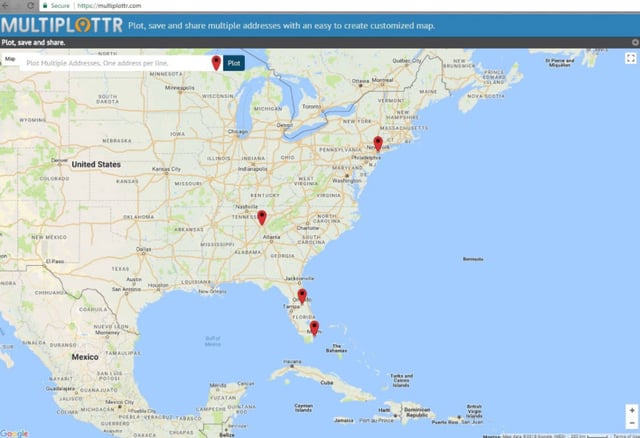
If you simply want to plot pushpins quickly for a PowerPoint visual, this tool is even quicker to use than Google My Maps. Literally, copy and paste your addresses into the plot line, click “Plot,” and you’re done. You can always save maps, edit pins, create legends, and more, but whether you’re looking to plot a quick ‘throw-away’ map or something more in-depth, this tool can help you do it in a blazing fast fashion.
Excel 3D Maps
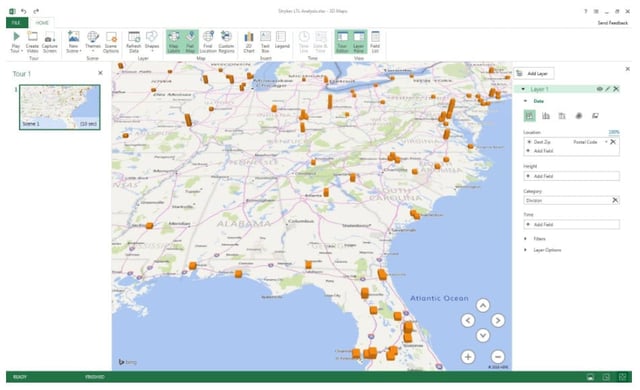
Fully supported since the advent of Office 365, I LOVE THIS TOOL. You’re probably already handling all your mapping and geodata within Excel anyway – so why not plot it directly in Excel! The learning curve is fairly quick with this tool, and there are plenty of options to play around with. Whether you want to show a heat map, bar chart, or time-based growth chart, it’s all very easy to produce and helps bring your data file to life in a way that will impress.
Additionally, there are many other ways to take 3D Maps to the next level. For example, if you wanted to outline a three-digit zip boundary, download and layer in shapefiles onto your map. This requires a little more technical expertise, but it’s something that you can learn within 1-2 hours with a few Google searches and trial and error within the tool.
3- Digit Zip Map
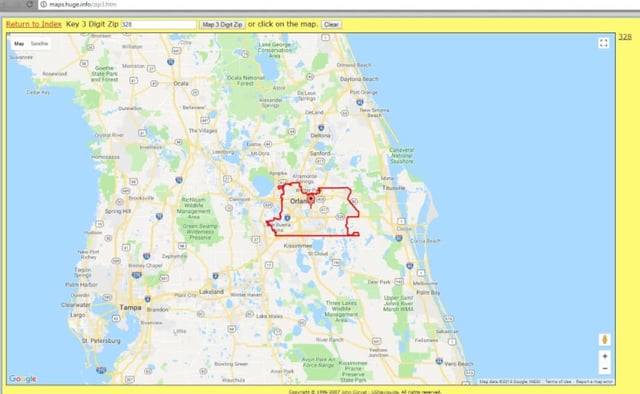
There are roughly 43,000 zip codes in the U.S., and the list grows each year. Therefore, most within the transportation industry choose to look at the 929 three-digit zips instead as it easier to digest information. While it’s fairly easy to run a pivot table or report on volume to each of the three digit zips, it’s often harder to visualize the shape or actual geographical zone of a 3-digit zip territory as it encompasses all zip codes with that three-digit prefix. The tool allows you to do exactly that. Type it in, press ‘Map 3 Digit Zip’ and you know the boundaries immediately. Also, note that it allows you to enter in multiple 3-digit zip zones.
OptiMap
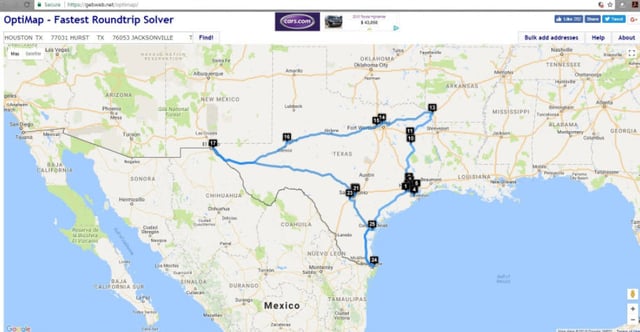
Suppose you have 25 addresses to visit and need to find the optimal way to do so. OptiMap allows you to do just that. Simply bulk
Point to Point Distance Calculator
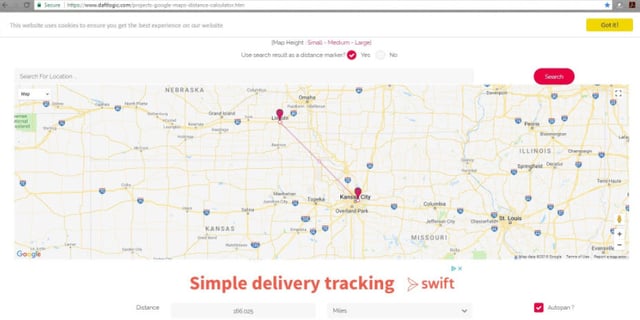
Suppose you need to know what cities are within 200 miles of say, Kansas City. This tool can quickly help as it operates on the premise of clicking on the origin, then on the destination, with a mileage output. It’s much faster than a Google Map trial and error session, but note the big disclaimer here – it uses the Great Circle Formula (as the crow flies) and will vary from actual driving distances produced by Google Maps. It’s a great high-level tool to get a feel for mileages from a certain origin location.
Batch Geocoding
Need to convert addresses to latitude and longitude coordinates? If you’re looking to batch upload and download lat/long coordinates and don’t have an in-house tool to do so at your company, this is a great free tool to do so. Over the years, there have been a number of batch geo-code upload/download tools pop up, but I like this one – it’s simple and straight-forward to use, plotting each point on the map in addition to producing the data you need.
Tableau Public
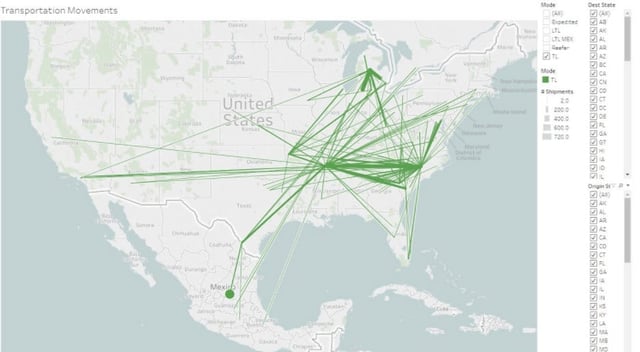
By far the most challenging and complex tool to learn in this group of 8, you can produce beautiful flow maps that will blow away your audience. Tableau Public is a free tool (not meant for commercial use), but if you’ve got some interesting mapping projects to undertake on the side, it’s a wonderful tool with the most flexibility that I’ve found in any free-to-use tool on the net. With the right address and geo (lat/long) information, you can seamlessly put together dot plots, shaded zone maps, or flow maps.
To Sum It All Up
I am thrilled to offer you these free tools. I have found them very helpful, but if you feel you might need something more than the free tools I've mentioned; you may be on the proactive side of a network optimization. In that case, our eBook on the importance of your design could help you in your research, Supply Chain Network Design. In it, you'll get an in-depth look at how our optimization team works through a project with our case study. At either rate, would love to hear your thoughts in the comment section below.


